
Energy Dispersive Spectroscopy Services
Energy Dispersive Spectroscopy, also knows as EDS or EDX, and sometimes even as EDAX is a non-destrutive way to get the elemental composition of an element. It also allows for spatial resolution down to a Micron, in other words, elemental analysis can be done in very selected areas as small as 1/2 a micron in size. With the EDS, we can identify the elemental make-up of a sample as well as the distribution and concentration of elements present.
Houston Electron Microscopy’s SEM is equipped with a state-of-the-art integrated IXRF System Energy Dispersive Spectrometer (EDS). Using the latest SDD technology and an ultrathin window, elemental data from Beryllium (Z=4) through Plutonium (Z=94) is collected at extremely high rates for elemental analysis. Additionally, built-in software allows for stoichiometric calculations of compounds present such as oxides, carbides, etc.
- New Silicon Drift Detector (SDD) – LN2 free, Resolution: <128eV@Mn or better,
- Ultra-thin window for detection of elements from Be to Pu,
- Ultra high data acquisition rates for fast analysis and mapping
IXRF ENERGY DISPERSIVE X-RAY SYSTEM
- Quantitative elemental analysis using alloy standards-based analysis within ±2% relative
- Image Segmentation for “Phase Analysis”
- Automated Particle Analysis
- Elemental and compound Mapping & Line Scans
Iridium Ultra Software:
Elemental and compound information can be viewed in several formats including elemental spectrums to identify the elements present, quantitative atomic and weight percent calculations, and x-ray mapping that combines the image with its chemical composition as shown below.
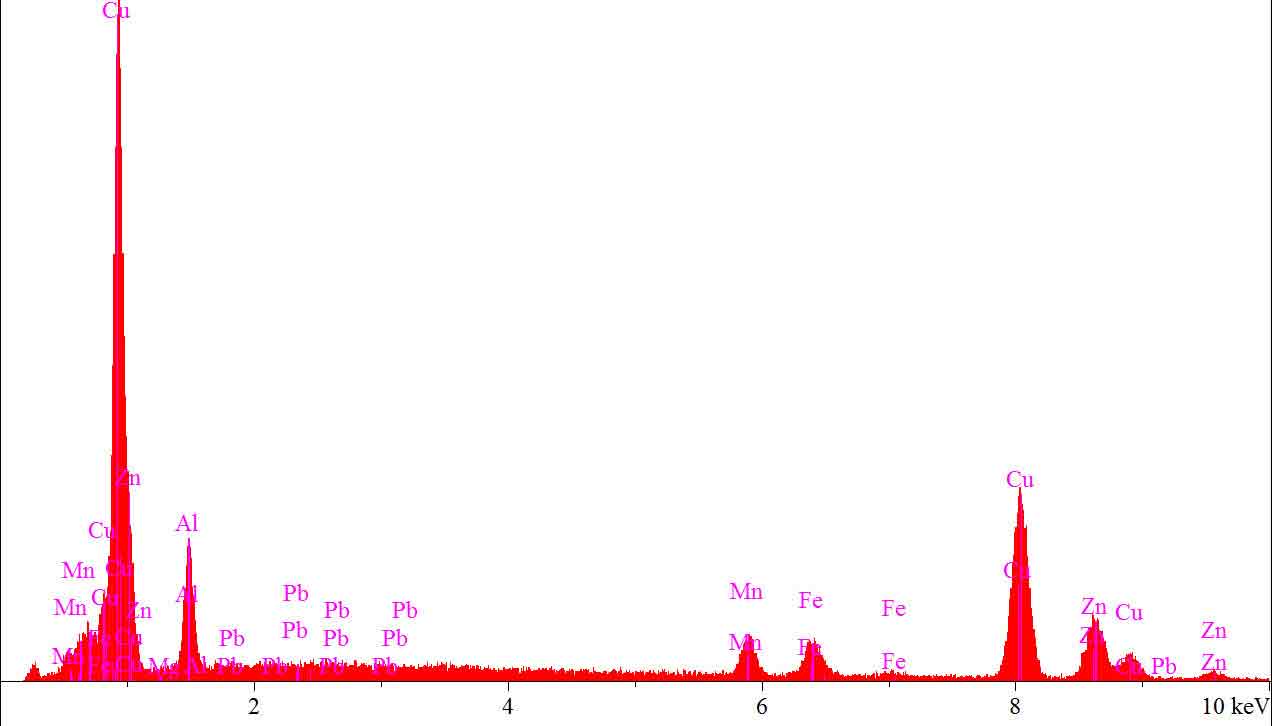
Typical EDS Spectrum
Typical EDS (or EDX) spectrum showing how characteristic X-rays correspond to different elements.
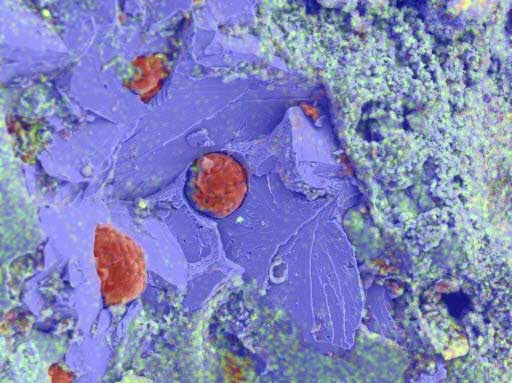
Elemental X-ray Map
Elemental X-ray map of Carbon, Iron, and Oxygen mapped onto a nodular cast iron fracture. The red spheres are nodules of graphite (carabon) in a matrix of iron (blue). Oxygen is set as yellow, so rust, FE2O3, appears greenish.
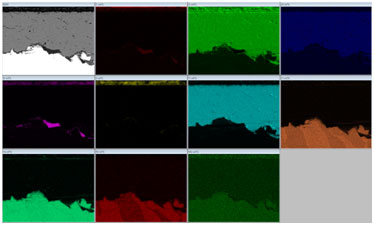
EDS Element Mapping
EDS Element Mapping can also be done for each individual element separately as illustrated above.
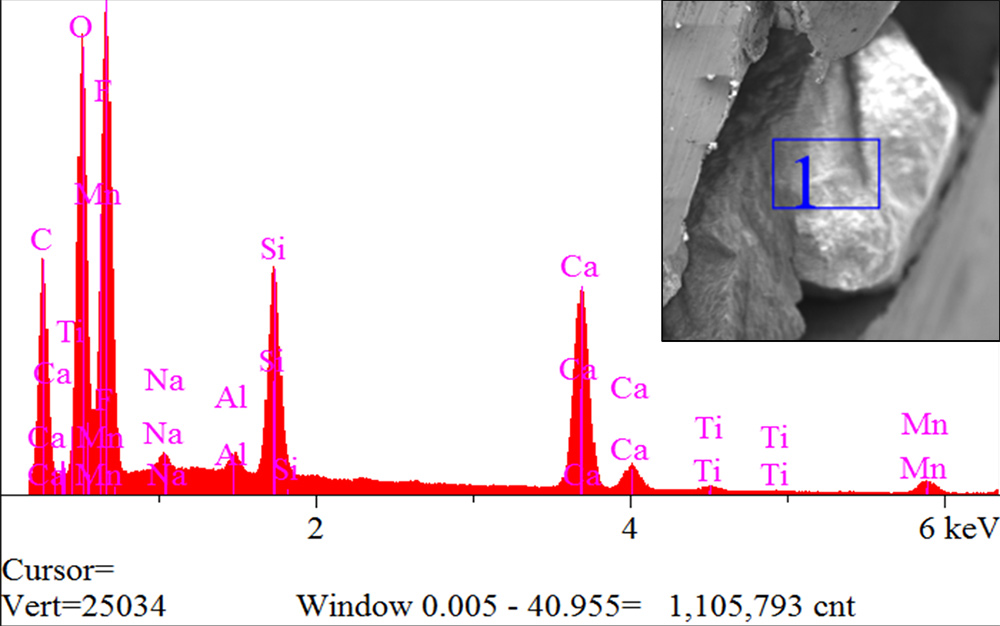
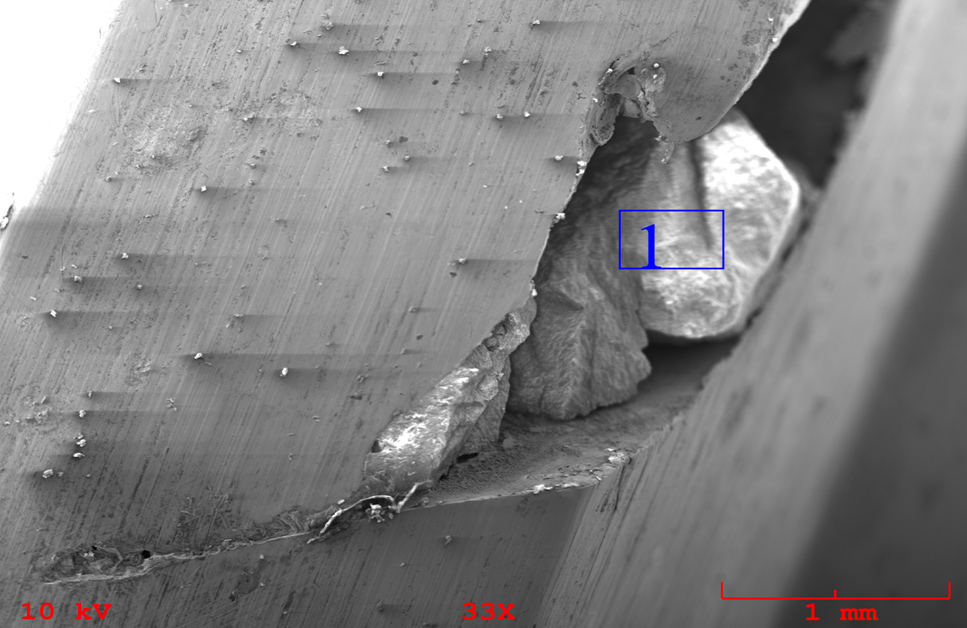
EDS Element Spectrum with SEM Image Inset
EDS Element spectrum with SEM image inset. The square labeled 1 markeds the location of EDS analysis
How the SEM/EDX works
The most powerful advantage of an EDS is the ability to analyze the chemical composition of anything that can be seen in the SEM.
For an intense explanation on EDS check out "Energy Dispersive Spectroscopy on the SEM A Primer" by Bob Hafner.
Featured Applications
- Failure Analysis
- Fracture surface characterization
- Corrosion deposti analysis
- Identification of process abnormalities
- Mapping and identification of geological structures
- Phase and particle analysis
- Morphology and weight ratio of the PDC
- Particle contamination in oils
Available for download is a Presentation of SEM & EDS applications and examples (pdf file) with more information.
Advantages
- Experience
- Modern SEM/EDS System
- No hidden charges
- Easy and quick availability
- Conveniently located in Northwest Houston
- We get answers
SEM + EDS + HEM = ANSWERS

Focus to Know and Empower!
+1 281.888.4261